This section includes code for processing and analyzing gene coexpression data.
Table of contents
Mutual rank coexpression analysis
Introduction
There are many different ways to analyze coexpression data, and mutual rank (MR) is one of the coexpression methods we found to be most useful for discovering new biosynthetic genes. Mutual rank, the geometric mean of the ranked Pearson’s Correlation Coefficient (PCCs) between a pair of genes. It was shown to be a better indicator of functional associations between genes than PCC values and is thought to be more robust to noisy or heteroscedastic data due to the use of ranked PCCs. Generally speaking, MR values below ~25 are a strong indicator of coexpression and functional association, although we generally used an MR cutoff of 100 to find additional candidate genes. You can find more details about MR and how it can be used for coexpression analyses in the links above.
MutRank
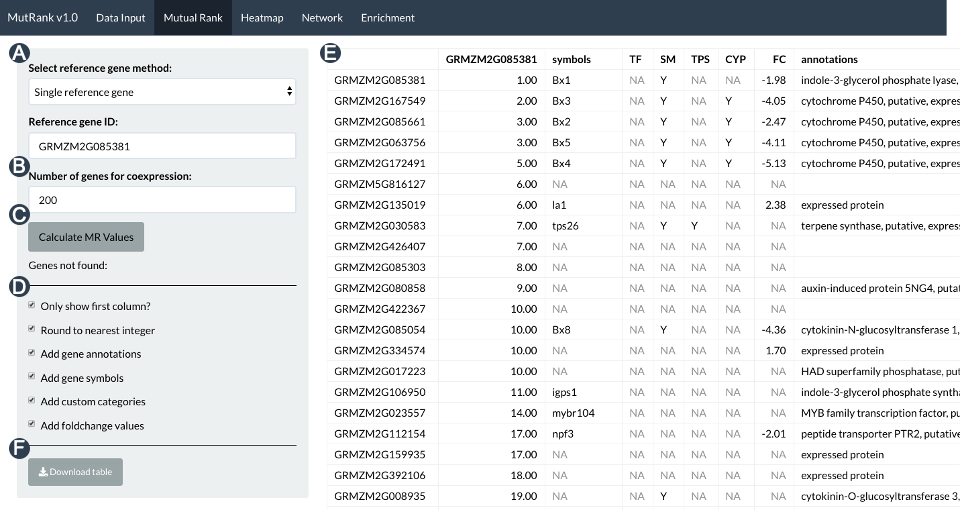
MutRank is an R shiny web-application for exploratory targeted mutual rank-based coexpression analyses integrated with user-provided supporting information. We have developed the Shiny app in 2019-2020. I won’t go into too much details as it is fully explained in the paper and GitHub repository. One thing I will mention, as it relates to the next section, is that the Shiny app only calculates the MR values between a selected gene and the top 500 genes with the highest PCC score. We set this limitation because calculating MR values on the whole transcriptome is not scalable in R on personal computers. In the next section, I will describe a Python package I am developing, MutClust, that uses some new Python methods to allow a much more scalable MR coexpression analysis on workstations, and maybe personal computers, with sufficient RAM memory.
Data input menu 
Mutual rank menu 
MutClust
MutClust is a Python package designed for RNA-seq gene coexpression analyses. It performs mutual rank (MR)-based clustering of coexpressed genes and identifies enriched Gene Ontology (GO) terms for the resulting clusters. The package is optimized for speed, able to run a whole-genome coexpression analysis in minutes. MutClust uses Leiden clustering instead of the ClusterONE package that was described in the Wisecaver paper. More details about the MutClust package can be found in the GitHub repository. I am in the process of developing it so there might be additional changes and improvements.
Example use case
I have used MutClust to analyze five different maize transcriptomic datasets (PRJEB10574, PRJEB36014, PRJEB67964, PRJNA383416, PRJNA990645) that contain a relatively large number of samples. While we generally use the MR values to consider the functional association between genes, I took a different approach here. Instead, I parsed the clustering results of the complete network, filtered the clusters for genes predicted to be associated with plant specialized metabolism using Pfam domains (as described in the Wisecaver paper), and counted the unique cluster pairs. I then filtered the unique cluster pairs if they showed up to be coexpressed in at least two of the transcripomic experiments. The results were visualized using Cytoscape and the cytoscape graph file is available here. The list of Pfam associated with specialized metabolism pathways is available here.
In the image below, we can see the network graph of maize specialized metabolism genes. The major maize terpene synthases (TPSs) are colored in orange and the edge widths are adjusted based on the number of experiments the MR coexpression was detected in. 
import os
import glob
import pandas as pd

# Get a list of all specialized metabolism genes
sm = pd.read_csv("Wisecaver_Pfams.tsv", sep="\t")
sm["Pfam accn"] = sm["Pfam accn"].str.split(".").str[0]
sm_list = sm["Pfam accn"].unique().tolist()

pfam = pd.read_csv("ZmB73.ipr.tsv.gz", sep="\t")
pfam = pfam[pfam["domain_id"].isin(sm_list)]
sm_genes = pfam["geneID"].unique().tolist()

df_list = []

for fl in glob.glob("*clusters.tsv"):
    acc = os.path.basename(fl).split(".")[0]
    print("Starting:", acc)

    # Load the cluster dataframe
    cls_df = pd.read_csv(fl, sep="\t")

    # Filter the genes that are not in the specialized metabolism list
    cls_df = cls_df[cls_df["geneID"].isin(sm_genes)]

    # Remove clusters that don't have at least two genes in them
    cls_df = cls_df.groupby("clusterID").filter(lambda x: len(x) > 1)

    # Load the MR dataframe
    mr_df = pd.read_csv(f"{acc}.mrs.tsv", sep="\t")
    mr_df = mr_df[mr_df["MR"]<50]
    mr_df["comb"] = mr_df.apply(lambda x: "-".join(sorted([x["Gene1"], x["Gene2"]])), axis=1)
    mr_df["Gene1"] = mr_df["tmp"].apply(lambda x: x.split("-")[0])
    mr_df["Gene2"] = mr_df["tmp"].apply(lambda x: x.split("-")[1])
    mr_df = mr_df.drop(["ED"], axis=1)

    cls_genes = cls_df["geneID"].unique().tolist()
    df_list.append(mr_df[mr_df["Gene1"].isin(cls_genes) & mr_df["Gene2"].isin(cls_genes)])

comb_df = pd.concat(df_list)

# Group by 'comb' and calculate both counts and minimum values in 'mr'
comb_df = comb_df.groupby('comb').agg(
    count=('comb', 'size'),  # Count occurrences of each group
    min_mr=('MR', 'min')     # Minimum value in 'mr' column
).reset_index()

comb_df["source"] = comb_df["comb"].apply(lambda x: x.split("-")[0])
comb_df["target"] = comb_df["comb"].apply(lambda x: x.split("-")[1])
comb_df = comb_df.drop(["comb"], axis=1)

comb_df = comb_df[["source", "target", "min_mr", "count"]]
comb_df[comb_df["count"]>1]
comb_df.to_csv("comb_df.tsv", sep="\t", index=False)