Table of contents
This section will contain the code and additional information about the apps in the future.
Omics Pages
Expression Plot
Build a simple protein-based phylogenetic tree from a list of gene IDs. Press the example button to see how it works.

Apps pages
SimpleTree
Build a simple protein-based phylogenetic tree from a list of gene IDs. Press the example button to see how it works.

Domain Architecture
Generate a domain architecture plot for a given list of genes that have been annotated in the database. The database currently supports the default InterProScan annotations, such as Pfam domains, and LRRprofiler plant receptor annotations.

Protein Alignment
Generate a simple and interactive protein alignment from a list of selected gene IDs. The genome graph is generated using a Dash app. Press the example button to see how it works.

Genome Graph
Build a simple genome graph showing the location of selected genes across the genomes. The genome graph is generated using BioPython, and currently only supports Arabidopsis and Maize, although adding support to more genomes is simple. Press the example button to see how it works.

GO Enrichment
Run a quick and simple GO enrichment analysis from a list of selected gene IDs. Press the example button to see how it works.

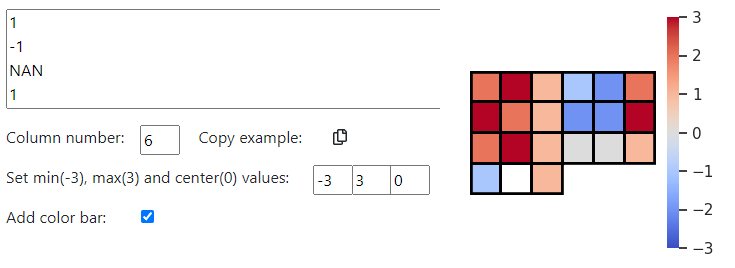
Mini-heatmaps
The mini-heatmaps plotting app was inspired by the gene pathway and gene family heatmap visualization produced by MapMan. This can be useful for visualizing quantitative changes in any group of genes. I used an sns heatmap and then added a rectangle to cover empty cells. Although it works fine, if I had the time, I would re-write to just draw the individual rectangle to make a cleaner figures. Press the “Copy example” button and paste the example data into the text box to get the mini-heatmap. Replacing numerical values with NaN will color the cells white.